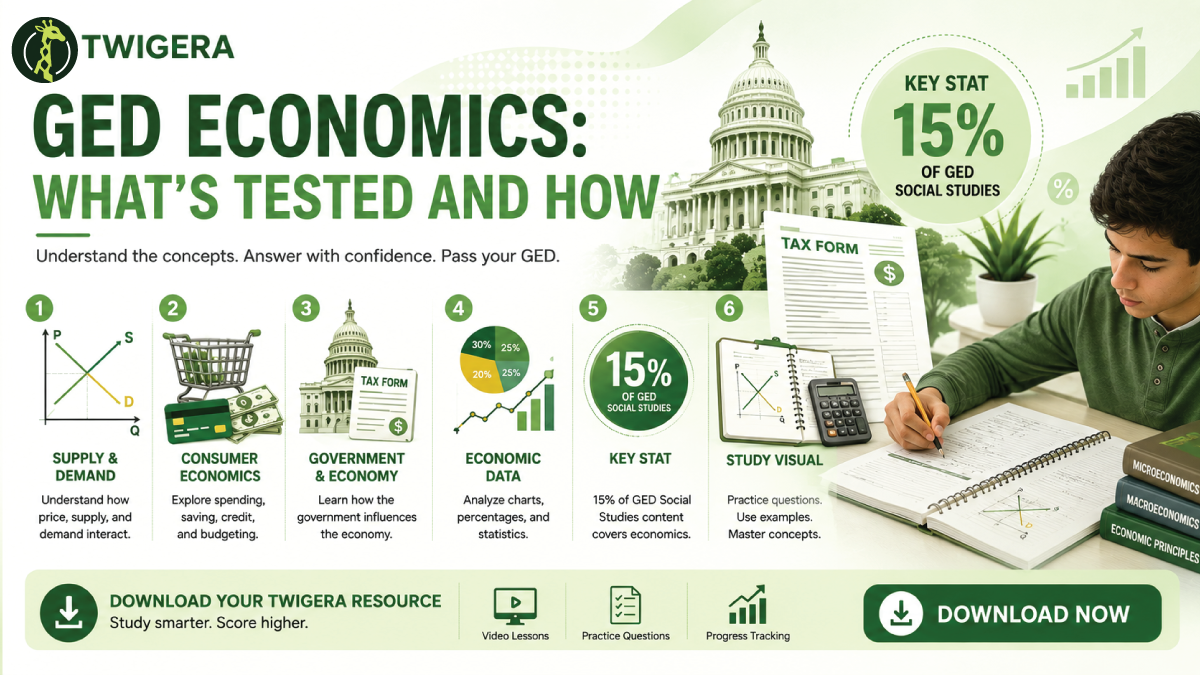
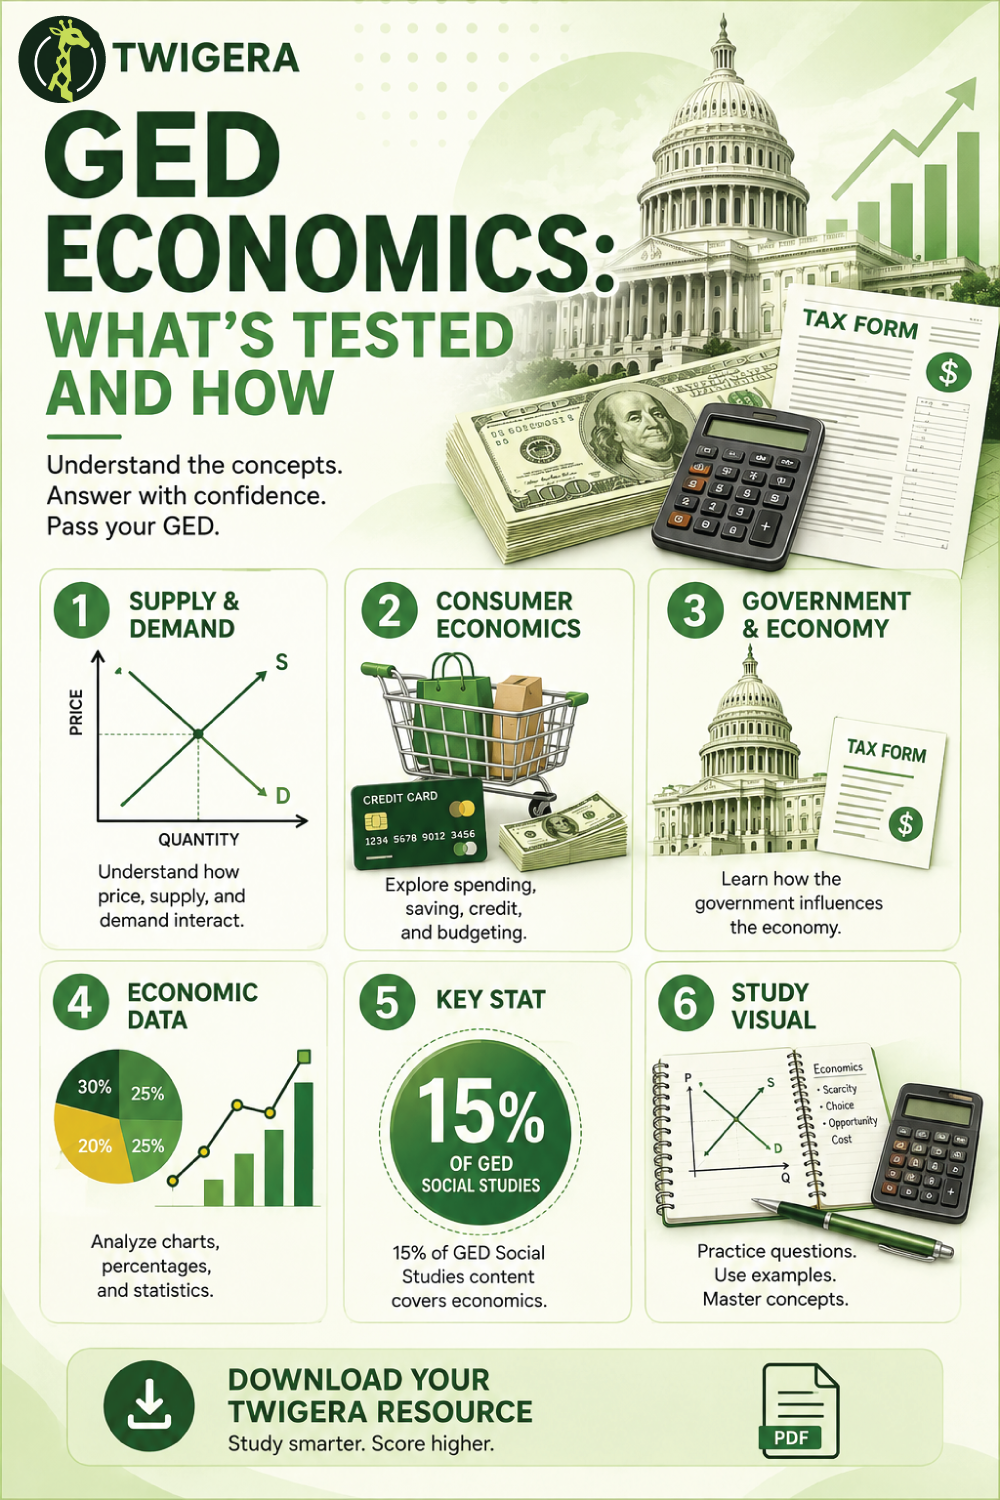
You do not need an economics background. You need the fundamentals, and you need to recognize them wearing everyday clothes — a household budget, a ticket price, a wage rise, an unemployment table.
The economics portion falls into several connected areas. The assessment guide includes fundamental economic concepts, microeconomics and macroeconomics, consumer economics, and the economic events that shaped government, exploration, colonization and industrial development.
Area | What to study |
|---|
Basic concepts | Scarcity, opportunity cost, markets, incentives |
Supply and demand | Prices, supply, demand, competition, equilibrium |
Government | Taxes, regulation, fiscal and monetary policy |
Consumers | Credit, interest, savings, banking, consumer protection |
Labor | Wages, employment, productivity |
Economic data | Graphs, tables, percentages, mean, median and mode |
Those six areas are not equally likely to appear. Basic concepts and supply and demand carry the most questions, because they underpin everything else. Government policy and consumer economics come next. Pure labor questions are the rarest of the group. Economic data, though, is different in kind: it is not really a topic at all but a skill layered on top of the other five, so a chart about unemployment is simultaneously a labor question and a data question.
That overlap is why studying economics as six separate lists is inefficient. Every one of these areas can be examined through a graph, a table or a short scenario, and the reasoning the test rewards is the same each time: identify the concept, read what the source actually says, and resist conclusions the source has not supported.
The practical takeaway is simple: learn the concept, then practice recognizing it inside a situation.
Scarcity exists because resources are limited while people's wants and needs exceed what is available. Suppose you have $100 but need to cover transport, food and a school registration fee. You cannot spend the same $100 three times, so you have to choose. That is scarcity in everyday life, and it is the idea every other economics concept is built on.
Opportunity cost is the next best alternative you give up when you make a choice. Say you have $40 and can buy a study guide or spend it on entertainment. Choose the study guide, and the entertainment you forfeited is your opportunity cost.
The GED presents this as a short scenario rather than a definition question. One habit does most of the work here: ask what the person gave up by choosing what they chose. Note that the opportunity cost is the alternative forgone, not the money spent — that distinction is exactly what the distractor answers are built to exploit.
Supply is how much of a product or service is available. Demand is how much consumers are willing and able to buy. When demand rises while supply stays limited, prices tend to rise. When supply rises while demand holds steady, prices face downward pressure.
A popular concert has a few tickets left and thousands of people still want them: limited supply meeting high demand pushes prices up. For supply and demand GED questions, the decisive move is identifying what changed first. Did supply change, did demand change, or did both?
Equilibrium is the point where quantity supplied and quantity demanded balance. You will usually meet it as a graph with two crossing curves. Do not let the terminology distract you — find where the lines meet and read what the graph is actually reporting at that point.
Know the broad differences between economic systems, because the test tends to describe one and ask you to name it.
Market economy: economic decisions are driven largely by consumers and businesses.
Command economy: the government plays the central role in economic decisions.
Mixed economy: market activity combined with government involvement.
Scarcity creates choices, and choices create opportunity costs. If you hold on to that one sentence, a surprising share of the economics items become answerable even when the vocabulary in the question is unfamiliar.
Government affects economic activity through taxation, spending, regulation and monetary policy. The exam tests whether you can label the mechanism at work, so keep the four cleanly separated in your head.
Governments collect taxes to fund public services. A question may describe a tax rising or falling and ask what economic effect follows. Read the relationship the question actually describes rather than assuming every tax change produces the same result — the item is testing your reading as much as your economics.
Regulation is government rules affecting businesses, consumers or economic activity. If a question describes a rule requiring businesses to meet a standard and asks what role government is playing, regulation is the label it wants.
This pairing generates more GED economics questions than any other single distinction, and it is the one candidates most often blur under time pressure.
Fiscal policy: government spending and taxation. Increasing infrastructure spending is fiscal.
Monetary policy: the money supply and credit conditions, including interest rates. In the United States this is the work of the Federal Reserve, not Congress.
A quick test that rarely fails: if the action involves a budget — money the government is spending or collecting — it is fiscal. If it involves interest rates or the supply of money and credit, it is monetary.
Inflation is a general rise in prices over time. If the same $50 buys fewer goods than it did before because prices have risen broadly, inflation is in play. A recession is a significant decline in economic activity.
These two get confused constantly, and the exam knows it. Inflation is about prices; recession is about activity. They can occur together, but they are not the same measurement, and a question describing falling output is not describing inflation.
Labor and consumer economics is the part of GED economics that deals with money as people actually meet it: wages, employment, credit, interest, savings and consumer protection. The assessment guide explicitly includes consumer economics, naming types of credit, savings and banking, and consumer credit laws. It is the most practical area on the test, and the one most likely to describe a situation you have personally been in.
A wage is payment for work. Questions may ask you to compare wages, interpret employment data, or identify how a change in employment affects individuals or businesses. If a worker's hourly wage rises from $15 to $18, that is $3 more per hour before taxes and deductions. Expect the exam to test whether you noticed the "before deductions" qualifier. Productivity, separately, describes how efficiently goods or services are produced: a factory making more output from the same labor and resources has raised productivity.
Credit lets a person or business borrow money, or take something now and pay later — credit cards, personal loans, mortgages and auto loans. Interest is the cost of borrowing money or the return earned on money saved. Borrow $1,000 and repay $1,100, and that extra $100 represents interest and any other applicable charges. When you see credit, think borrowing; when you see interest, think the price attached to money over time.
Savings and banking questions usually ask why someone would deposit money rather than spend it. The answer is preparing for future expenses, or earning interest, depending on what the item tells you. Consumer protection covers the rules designed to protect people buying goods and services or using financial products; those questions typically ask what problem a given protection exists to solve.
Reading economic charts and graphs is a tested skill in its own right, not a bonus. The GED Social Studies test measures your ability to read and interpret graphs, charts and other data representations, and it includes measuring the center of a statistical dataset. Data questions are where prepared candidates quietly gain marks on unprepared ones, because the method is learnable in an afternoon and most people never learn it.
Read the title first — it tells you what is being measured. A chart headed "Unemployment Rate, 2020 to 2024" has already told you a great deal. Then check both axes: what does each represent, what units are in use, and what period is covered? Skipping those details is how you end up selecting an answer that sounds plausible but does not match the data. Official series like the Bureau of Labor Statistics unemployment data are the kind of source these items are modeled on.
Then look for what the data actually establishes. Consider this table:
Year | Unemployment rate |
|---|
2020 | 8% |
2021 | 6% |
2022 | 5% |
2023 | 4% |
What is directly supported? Only that unemployment decreased from 2020 through 2023. You cannot conclude that a particular government policy caused the decline unless the source supplies evidence for that link. Describe what the data shows before explaining why it happened — on the GED, the answer that explains a cause the source never established is almost always the trap.
You will meet basic calculation while working with economic information. Suppose a product costs $50 and rises to $60. The increase is $10, and comparing that with the original price gives $10 divided by $50, multiplied by 100 — a 20% increase. No advanced mathematics is required. The one thing that matters is choosing the correct starting point: percentage change is always measured against the original value, not the new one.
You can use a calculator on the GED for Social Studies questions that involve calculations. An on-screen TI-30XS is provided, and you may bring your own TI-30XS to a test center.
Economic data also calls for basic statistical reasoning, and the GED lists measuring the center of a statistical dataset among its Social Studies Practices. The mean is the average: $20, $30 and $40 sum to $90, divided by three, giving $30. The median is the middle value once the numbers are ordered: for $15, $20 and $35, the median is $20. The mode is the value appearing most often: in $10, $15, $15 and $20, the mode is $15. Mean is average, median is middle, mode is most often.
Answer all three before reading the explanations. Getting a question wrong and understanding why is worth more than getting it right by recognition.
Question 1. A student has $50 and chooses to buy a textbook instead of going to the movies. What represents the student's opportunity cost? (A) The $50. (B) The textbook. (C) The movie experience given up. (D) The student's future income.
Answer: C. The opportunity cost is the next best alternative given up. Option A is the money spent and option B is what was bought — both are attractive precisely because they are concrete, which is why they are offered.
Question 2. Demand for a product increases while its supply remains unchanged. What is likely to happen? (A) Price may increase. (B) Price must decrease. (C) Supply automatically doubles. (D) Demand disappears.
Answer: A. Higher demand against unchanged supply puts upward pressure on price. Note the hedged wording — "may increase" rather than "must". On GED items, the cautiously worded option is often the defensible one, because economics describes tendencies rather than guarantees.
Question 3. A table shows unemployment fell from 7% to 5% over three years. Which conclusion is directly supported? (A) The economy completely recovered. (B) Government policy caused the change. (C) Unemployment decreased during the period. (D) Every worker found a new job.
Answer: C. The table establishes a decline and nothing more. It does not establish a cause, a full recovery, or anything about every individual worker. This is the single most repeated pattern in GED social studies data questions.
Because the concept list is short, economics rewards depth over coverage. Learn the vocabulary — scarcity, opportunity cost, supply, demand, equilibrium, inflation, credit, interest, and fiscal versus monetary policy — then immediately place each term inside a situation. Do not stop at the definition. Ask how the concept would show up in a real financial decision or a business scenario, because that is the form the question will take.
Then practice with data: tables, graphs, percentages and basic statistics. Finally, review the reason behind each mistake. Did you misunderstand the concept, misread the graph, or use the wrong number in the calculation? Those are three different problems with three different fixes, and treating them as one is how study time gets wasted. If you want the whole subject on one page, the GED social studies cheat sheet condenses all four content areas. The GED Social Studies score guide explains what 145 actually requires.